 |
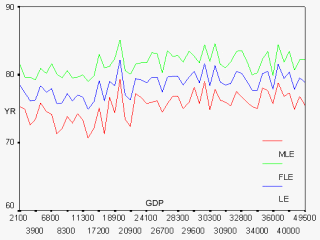
The diagram has 55 countries ordered by GDP.
These countries are easily identified by GDP when referring to the CIA World
Factbook 2005. Although longevity increases linearly with GDP, causative
variables are not identified here. Wages are determined by productivity,
life expectancy and educational cost. Much remains still little known. Also
this data is cross-sectional, and longitudinal data per country is obviously
more informative.
LE is life expectany, MLE male LE and FLE female LE. The order of countries
in the top 20 chart is for FLE. The Hong Kong, Singapore, Japan, Macao block
has a new winning look. GDP in US dollars, diet, air quality and very many
other variables like low fertility contributed to these Asian successes in
longevity. How does low labor cost affect longevity? How does diet affect
longevity? What is the migrant effect? |
