 |
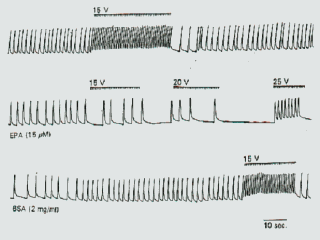
Figure 10. The response of the cultured
neonatal rat cardiomyocytes to electrical stimuli delivered from an external
applied voltage source. The three strips are continuous tracings of the
contraction rate and amplitude of a single myocyte within a clump of
myocytes. In the top tracing an external field of 15 V delivered stimuli
that readily doubled the beating rate. The second tracing shows that with
EPA (15 µM) added to the superfusate the
beating rate began to slow, but when an external electrical field of 15 V
was applied the cells paid no attention to the stimuli nor did they at 20 V.
At 25 V they responded, but only to every other stimulus. Upon addition of
the delipidated bovine serum albumin to the superfusate, the free EPA was
extracted from the myocyte and the contractions returned to the control
rate. Now the cells doubled their beating rate in response to stimuli
delivered at 15 V, just as they had initially. |
