 |
The basic
algorithms presented in the last six slides are far from adequate for exposure
calculation. For example, the last slide suggested that data on handler exposure for other
chemicals can be used as surrogate, in that handler exposures tend to be proportional to
the amount of chemical handled, rather than to the specific chemical handled. Yet the
personal protective equipment (PPE) and clothing requirements for one product may be quite
different from those for the surrogate product. Adjustment for such differences would
require a knowledge of clothing penetration or of the mitigation efficacy of certain PPE
(e.g., respirator, headgear, goggles). Because people can be subject to the same or
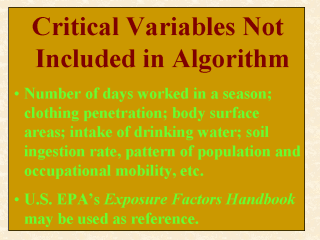
different long- and short-term adverse effects, the number of days they work in a season
is a critical factor in calculating their intermediate and long-term exposures from
handling a chemical. It is also difficult to determine what actually constitutes an
average or a reasonable maximum default rate or value for some of the exposure-related
parameters. To overcome some of the controversies over the use of these values, U.S. EPA
(1997a) has provided a three-volume Exposure Factors Handbook as reference.
Included in this handbook are literature reviews and some suggested percentiles, means,
and medians for (age- or gender-specific): inhalation rates; soil ingestion rates and
pica; patterns of occupational and population mobility; intake rates of various food items
(including vegetables, fruits, fish, meat products, and grain products); body surface
areas; intake of drinking water; intake of breast milk; and many more. |