 |
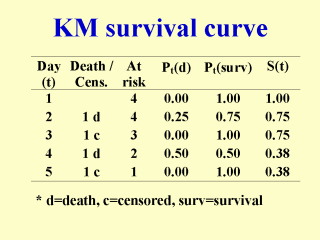
Calculating a Kaplan-Meier (KM) survival
curve: Hypothetically
there are four subjects in the control group of a clinical trial. There are two deaths
(day 2 and day 4) and two censored cases (day 3 and day 5). At the beginning all four
subjects are at risk of death. In day 2 one out of four at risk subjects die, giving a
probability of death Pt (death)=0.25 and reducing the number at risk to three
for the next day. One subject is lost to follow-up in day 3; the censoring is assumed to
happen at the end of the day. So in day 4 the number at risk is two. One out of two at
risk subjects dies, so Pt (death)=0.5. Pt(surv), the probability of
survival, is equal to 1-Pt(death). The cumulative survival probability, S(t),
is initially 1. Multiplying S(t) and Pt+1(surv) gives S(t+1). For instance,
S(4)=S(3) x P4(surv)=0.75 x 0.50=0.38, rounded to two significant digits.
The KM method utilises information from censored cases prior to their censoring time. Also
see Chapter 12 of Statistics
at Square one. |
