| front |1 |2 |3 |4 |5 |6 |7 |8 |9 |10 |11 |12 |13 |14 |15 |16 |17 |18 |19 |20 |21 |22 |23 |24 |25 |26 |27 |28 |29 |30 |31 |32 |33 |34 |35 |36 |37 |38 |39 |40 |41 |42 |43 |review |
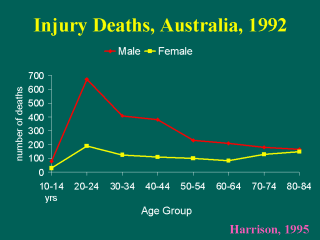 |
In this slide, we see the number of injury deaths in Australia by age and gender. The graph suggests that injury deaths are particularly significant in young adults and men. |