 |
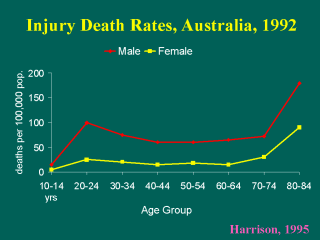
In this slide, we
see the injury death rates in Australia by age and gender. The message of
the graph has changed from that previously. Here we see that injuries are
significant in both the young and the very old (75+ years). The previous
slide considered only the “numerator”; the number of injury deaths. It’s
message is different from this slide, which included a denominator (the
population in the respective age and gender categories). Thus, numerator and
denominator data are both important to defining the magnitude of the problem.
|
