 |
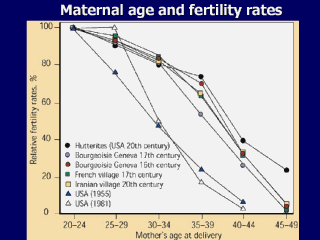
This slide exemplifies another effect that
later childbearing in developed countries may have on overall fertility
rates. As this figure shows, one of the strongest risk factors for
infertility is age, and you can see that declines in fertility rates are
observed as early as 30 to 35 years of age and are rather dramatic by age
40. Certainly, there is a continual, almost linear decline with age noted in
this graph.
Increases in age-linked gynecologic maladies, such as endometriosis and
fibroids, oocyte aging, and more time for exposure to STDs and to develop
pelvic inflammatory disease (or PID) or multiple cases of PID likely explain
this relationship. |
