| front |1 |2 |3 |4 |5 |6 |7 |8 |9 |10 |11 |12 |13 |14 |15 |16 |17 |18 |19 |20 |21 |22 |23 |24 |25 |26 |27 |28 |29 |30 |review |
 |
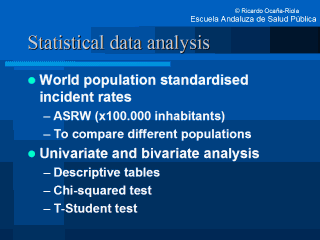
To calculate incidence rates, both crude and standardised, mathematical definitions and expressions agreed upon by all the population cancer registries were used [5]. In the descriptive analysis, standard methods were used, including tables and figures to facilitate outcomes’ expression. The Chi-squared test was applied in order to evaluate the association between categorical variables; the t-Student test was used for continuous variables. Both Chi-squared and t-Student tests were applied using an alpha error equal to 0.05. |