| front |1 |2 |3 |4 |5 |6 |7 |8 |9 |10 |11 |12 |13 |14 |15 |16 |17 |18 |19 |20 |21 |22 |23 |24 |25 |26 |27 |28 |29 |30 |31 |32 |33 |34 |35 |36 |37 |38 |39 |40 |41 |42 |43 |44 |45 |review |
 |
One question: the
95% CI in the example study of type I diabetes mentions [382-402], while the
RR was 930? Is that correct? Probably this CI relates to a point estimate
around 390 rather than 930? This would be easy to correct in ppt, but not in
print!
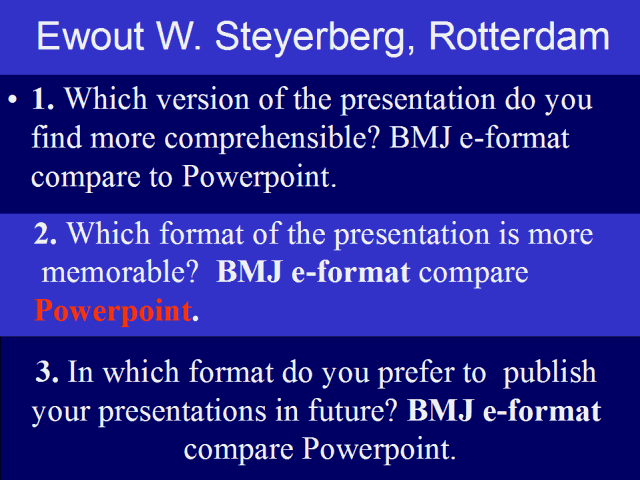
Further, I enjoyed both forms of presentation, with more humour in the ppt presentation (e.g. horses/cars in time). Ppt also is more memorable. Ewout W. Steyerberg, PhD, Clinical epidemiologist, an author of Supercourse’s lecture «Validation of predictive regression models». |